This final year project thesis was written as partial fulfilment for my bachelor degree in mechanical engineering. This project is originally titled “ Mapping the Noise from Urban Rail Transport Lines in The Greater Klang Valley Area “.
This thesis can be downloaded at page 3.
Abstract
The Malaysian Department of Environment (DOE) has set environmental noise limitations and regulation standards, which apply to railways and transit trains. The maximum noise and vibration levels must be adhered to avoid human discomfort. The objectives of this project are to analyse, evaluate, and map the train passing noise generated along the LRT Kelana Jaya Line. The ambience and train passing noise around LRT train stations were measured with a Sound Level Meter and recorded in LAeq noise levels. Taipan-Wawasan, Taman Bahagia-Taman Paramount, and Gombak-Taman Melati were chosen as LRT train stations. Measurements were taken from 50 to 950 meters, with an increment of 150 meters. Noise maps were created using the Quantum Geographic Information System (QGIS) program. Train passing affects the surrounding noise level within 200 meters of train lines in the Taipan-Wawasan station area, turning redder than the ambient noise map. In contrast, 500 meters from train tracks in the Taman Bahagia-Taman Paramount station area turns more orange than the ambient noise map. Within 200 meters of train lines of Gombak- Taman Melati, the area turns more orange than the ambient noise map. This noise mapping project is valuable and necessary because it demonstrates the impact of LRT train noise on the surrounding environment and enables researchers to investigate the noise pollution effects of future development plans and their surroundings and implement risk mitigation. Hence, related authorities must take steps to reduce the noise generated by LRT trains as recommended by the DOE.
List of abbreviations
- DOE – Malaysia’s Department of Environment
- DOSH – Malaysia’s Department of Occupational Safety and Health
- IDW – Inverse Distance Weighting
- IOSH – Institution of Occupational Safety and Health
- KL – Kuala Lumpur
- KTMB – Malayan Railways Limited
- LAeq – A-weighted equivalent continuous noise level
- LRT – Light Rail Transit
- MOT – Ministry of Transport, Malaysia
- MRT – Mass Rapid Transit
- QGIS – Quantum Geographic Information System
- SLM – Sound Level Meter
- URT – Urban Rail Transport
- US OSHA – United States’ Occupational Safety and Health Administration
- WHO – World Health Organization
Chapter 1 – Introduction
1.1 Background of Study
In a heavily populated metropolitan area with numerous high-rise structures, noise pollution has been prioritised as an environmental concern (Li, Law, & Kwok, 2008). The definition of noise is a disturbing sound that is particularly loud or unpleasant (Lexico, n.d.). Global population growth increases consumption, and an expanding economy contributes to noise pollution. Almost 80 percent of metropolitan traffic noise is generated by vehicles such as trains, automobiles, buses, and motorcycles, which are significant noise producers in today’s environment. Throughout daily life, noise nuisance has been a substantial source of concern because of unwanted sound, including ambient noise released by industrial machine activities and modes of transit, such as aircraft, cars, and trains (Zambrano-Monserrate & Ruano, 2019). Since 1980, the World Health Organization (WHO) has recognised environmental noise pollution as a significant public health concern, owing to a growing understanding of the detrimental effects of environmental noise on human health and well-being (WHO, 2018).
The Klang Valley, located in the centre part of the Malaysian Peninsula’s west coast, encompasses an area of approximately 3234 km2 (Chan & Vu, 2017). The region consists of the Federal Territory of Kuala Lumpur, its suburbs, and the state of Selangor’s surrounding cities and towns. It is becoming more industrialised and urbanised. Due to the city’s expanding population, industrial areas, transportation, and other man-made activities, noise pollution problems exist. The severity of the noise pollution issue would also intensify in the upcoming years. As a growing nation aspiring to be developed, Malaysia seeks to preserve its capital city, green and intends to rank among the world’s “top 20 most liveable cities” by 2020. (Jabatan Perdana Menteri, 2010).
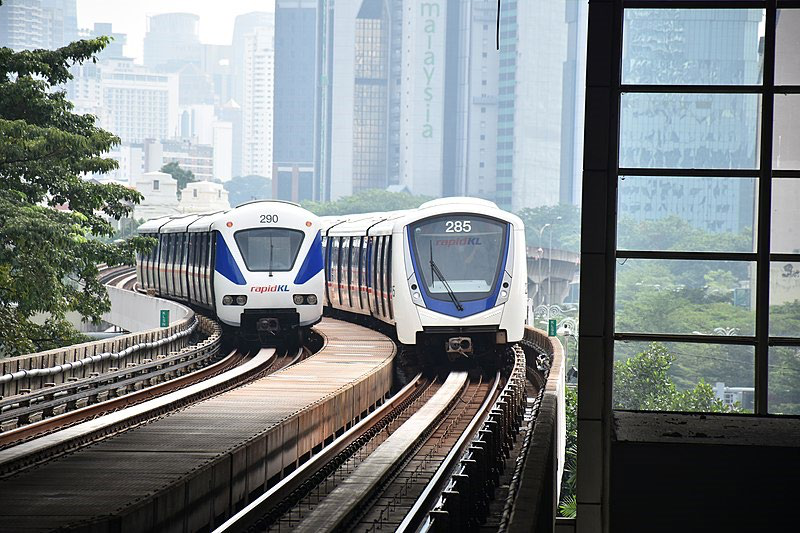
As a result, to meet the objectives, the government has expanded public transportation services in Klang Valley by building new railway lines such as the Light Rail Transit (LRT). The LRT system is a rail system used to transport passengers in metropolitan areas. The LRT Kelana Jaya Line (Line 5, formerly known as the PUTRA Line), as shown in Figure 1.1, comprises 37 stops and covers 46.4 kilometers between Gombak and Putra Heights. Unlike conventional trains that run on diesel and coal, LRT trains run on electricity; hence, it has a greener emission profile.
While railway transit is the most environmentally benign means of travel, it is unavoidable to acknowledge the noise pollution caused by trains (Shahidan, Maarof, Hannan, & Ali, 2017). Train noise depends on the type of train utilised, whether heavy or light, and the sound produced by rotation wheels on the rail tracks, contributing to the noise contribution (Grubliauskas et al., 2014). Grubliauskas discovered that the driving speed and train operation method influenced the loudness for automatic or manual handling. Near railway lines are residences, hospitals, and other noise- sensitive structures. Train noise significantly degrades the quality of life for most residents who live in these heavily crowded cities.
This project will examine the present amount of noise generated by the LRT Kelana Jaya Line. There is a study deficit in noise mapping for urban rail transit in Malaysia, notably in the Klang Valley, which could assist relevant authorities in implementing the noise minimization approach. The noise assessment is crucial because it is important to keep an eye on and investigate the government’s acceptable sound level range to help with policy development for sound abatement activities (Lee et al., 2020).
1.2 Problem Statement
Noise pollution has worsened because of the rapid growth of metropolitan regions and railway lines in the Klang Valley region. Malaysia operates urban rail transport (URT) systems such as monorails, light rail transit (LRT), and mass rapid transit (MRT). While these railway activities generated considerable noise as the train travelled along the track, they considerably reduced congestion in the Klang Valley area (Abdulrazza et al., 2020). Noise works as an environmental stressor, resulting in physiological health problems and disrupted daily activities. Excessive noise exposure has been demonstrated to produce discomfort, interrupt sleep, increase daily sleepiness, negatively impact patient outcomes and hospital staff performance, raise the risk of hypertension and cardiovascular disease, and reduce cognitive function in pupils (Basner et al., 2014). According to a study conducted in Chongqing, the noise at the measurement point near the light rail was over 80 dB, severely affecting the nearby residential buildings. The noise level was extremely high within 60 meters of the light rail (Zhao et al., 2020).
Malaysia’s Department of Environment (DOE) has set environmental noise limitations and regulation standards, which apply to railways and transit trains. The maximum noise and vibration levels that are established must be adhered to avoid human discomfort. Regrettably, there has been little research on the noise level generated by URT in Malaysia. This project seeks to close this gap by measuring the noise generated by the LRT Kelana Jaya Line and mapping the noise data collected along the rail lines.
1.3 Objectives
The specific objectives of this project are:
- To analyse and evaluate the train passing noise generated along the LRT Kelana Jaya Line;
- To map the train passing noise generated along the LRT Kelana Jaya Line
1.4 Scope of Study
This research will focus on the noise along the LRT Kelana Jaya Line with specific limitations, namely:
- Focusing only on the noise emitted from the above-ground portion of the LRT Kelana Jaya Line, which includes at-grade and elevated railway tracks; and
- Focusing only on areas 950 meters on either side of the LRT Kelana Jaya Line
- During the experiment, the ambient sounds of automobiles, construction equipment, aeroplanes, and emergency sirens were disregarded.
1.5 Thesis Outline
This undergraduate thesis is divided into five chapters: an overview of past research, a literature review, methodology, results and discussion, and a conclusion. The first chapter, Chapter 1, will introduce the project’s background study, the problem statement, objectives, and scope of the study. Chapter 2 will review previous research on environmental noise, urban rail transit noise, and noise mapping. The methodology of this project, as well as the flow of the method used to complete the project, will be detailed in Chapter 3. Chapter 4 contains the study’s results and analysis, which had been addressed and analysed considering the study’s objectives. The final chapter, Chapter 5, will conclude the entire study based on the results and whether the objective was met. Recommendations for further research on the topic will be made. This project’s societal and environmental implications will also be discussed.
Chapter 2 – Literature Review
2.1 General Noise
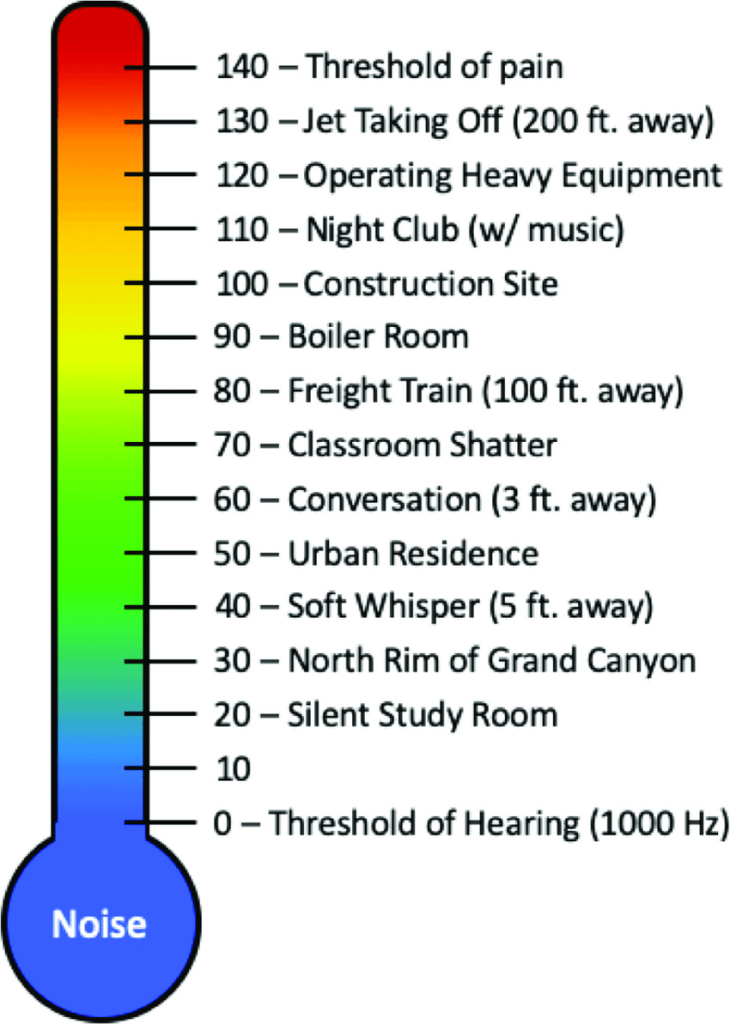
In acoustics, electronics, and physics, sound and noise are used interchangeably, although they have distinct implications when applied to listeners. Sound is vibrations that travel through the air or another medium and are audible when they reach the ear of a person or animal (Lexico, n.d.). Meanwhile, the definition of noise is an audible disturbance that is exceptionally loud or unpleasant. (Lexico, n.d.). Meanwhile, in engineering, noise also refers to signals that change without significance over time, whereas sound refers to meaningful signals (Fink, 2019). Noise is measured in decibels on a logarithmic scale. Typical noise levels in daily life include 40 dB, which corresponds to a whisper at 30 cm, and 100 dB, which corresponds to the sound of a propeller plane at 30 meters. A gain of 1 decibel is detectable, while a gain of 10 decibels doubles the perceived noise level. Figure 2.1 shows the typical sound level on the dBA scale (US OSHA, 1995).
According to the Centers for Disease Control and Prevention (2019), exposure to noise levels more than 70 decibels over an extended length of time may cause hearing loss. Extremely loud noises exceeding 120 decibels might cause acute ear damage. Otherwise, personal protective equipment such as earplugs or earmuffs were worn to minimise noise exposure. In Malaysia, very few studies and research have been conducted about noise pollution. This is because knowledge of noise pollution remains below average. Malaysia’s progress towards becoming a developed nation by 2020 has not, however, been devoid of environmental issues. The community’s noise level has increased because of the community’s population growth and socioeconomic developments.
2.2 Environmental Noise
In Malaysia, there are two main forms of noise: ambient noise and occupational noise. Community noise and noise irritation are connected to environmental noise (Leung et al., 2017; Segaran et al., 2020), while occupational noise is associated with noise exposure in the workplace (Jacquelyne AB et al., 2020; Abu Mansor et al., 2020). Noise pollution is sometimes overlooked since it cannot be seen or tasted, despite having negative impacts. The decibel (dB) is the environmental noise pollution unit, used to measure sound power, sound intensity, and sound pressure level (Kumar & Kumar, 2018). The Malaysian Department of Environment (DOE), Ministry of Water and Environment, Malaysian Department of Occupational Safety and Health (DOSH), and Ministry of Human Resources are accountable for environmental and occupational noise.
Due to the ambient noise generated by the presence of numerous people in one location, an urban setting is rarely fully silent (von Graevenitz, 2018). In accordance with Sustainable Development Goal 11 (SDG-11) on sustainable cities and communities, there is a need to investigate noise pollution in Malaysia, particularly in the vicinity of urban rail transit. Monitoring transportation noise for up-to-date and accurate information on environmental noise is essential for noise pollution enforcement and policy creation. The Malaysian authority stated that any train operation should comply with the released guidelines that need to be followed; which is in the range of 50 dB to 80 dB with respect to two periods; day and night (DOE, 2019), as can be referred to in Table 2.1.
| Receiving Land Use Category | Day Time (7.00 a.m. – 10.00 p.m.) | Night Time (10.00 p.m.– 7.00 a.m.) | Lmax (Day & Night) |
| Noise Sensitive Areas Low Density Residential Areas | 60 dBA | 50 dBA | 75 dBA |
| Suburban and Urban Residential Areas | 65 dBA | 60 dBA | 80 dBA |
| Commercial, Business | 70 dBA | 65 dBA | 80 dBA |
| Industrial | 75 dBA | 65 dBA | NA |
Excessive noise is defined by the Noise Exposure Regulations as a daily noise exposure level above 82 dB(A), a daily personal noise dosage exceeding fifty percent, a maximum sound pressure level exceeding 115 dB(A) at any time, or a peak sound pressure level surpassing 140 dB (C) (DOSH, 2019). The A-weighted Leq sound level is represented by dB (A), also known as decibels (A). In many applications, A- weighting is the conventional name for A frequency-weighted sound level measurement over the whole audio range that correlates well with perceived loudness. Meanwhile, Leq is the time-averaged sound level (LAT), the sound level in decibels with the same total sound energy as the observed fluctuation level. A C or flat frequency weighting can be used to measure the peak. Using the A curve adds its time constant, making True Peak measurement impossible. The C-weighted peak sound level is given in dB as LCpeak (C). C-weighting is utilised for high-level measurements and peak sound pressure levels. The A-weighting curve is commonly employed for general noise measurements; however, the C-weighting curve corresponds with human responses to high noise levels better. (Gracey, 2021).
2.3 Impact of Environmental Noise Pollution
Noise has become one of the most significant pollutants in modern cities, although the danger is sometimes neglected. Noise functions as an environmental stressor, causing physiological health difficulties that might interfere with everyday activities and communications. Excessive noise exposure has been linked to discomfort, sleep disruption, daytime drowsiness, poor patient outcomes and staff performance in hospitals, an increase in the prevalence of hypertension and cardiovascular disease, and worse cognitive performance in schoolchildren (Basner et al., 2014). The WHO has addressed environmental noise pollution as a public health concern since 1980, owing to a rising knowledge of the effects that exposure to environmental noise has on human health and welfare (WHO, 2018). According to recent research in Spain, noise pollution has surpassed air pollution as the biggest environmental risk factor in Barcelona (Mueller et al., 2017).
2.4 Urban Rail Transport in Klang Valley
Malaysia is on its way to become a modern country. Public transportation is one of the variables that might influence this condition. To fulfil this purpose, the Malaysian government has established and extended public rail transportation systems such as MRT, LRT, monorail, commuter, and Malayan Railways Limited (KTMB). The Klang Valley now features Malaysia’s most comprehensive rail transit system, which will serve as the future backbone of a transportation network that delivers an efficient, dependable, economical, and environmentally friendly travel option (Kwan et al., 2017). As shown in Figure 2.2, nine train lines are currently being operated in the Klang Valley, with two upcoming train lines (MRT Putrajaya Line and LRT Shah Alam Line).
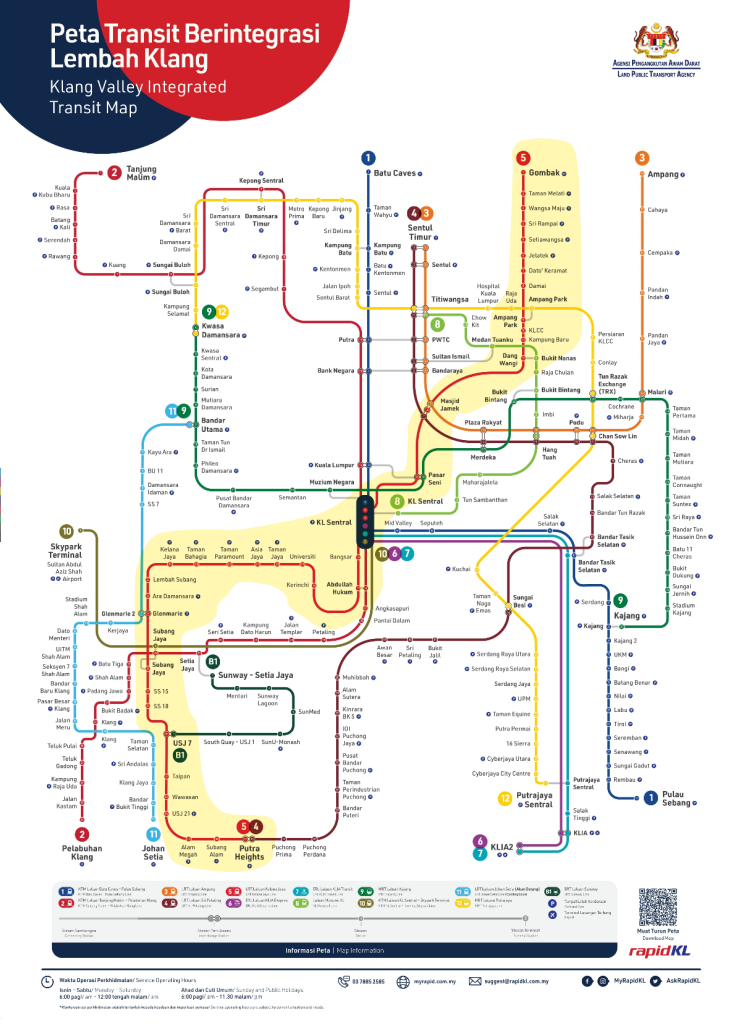
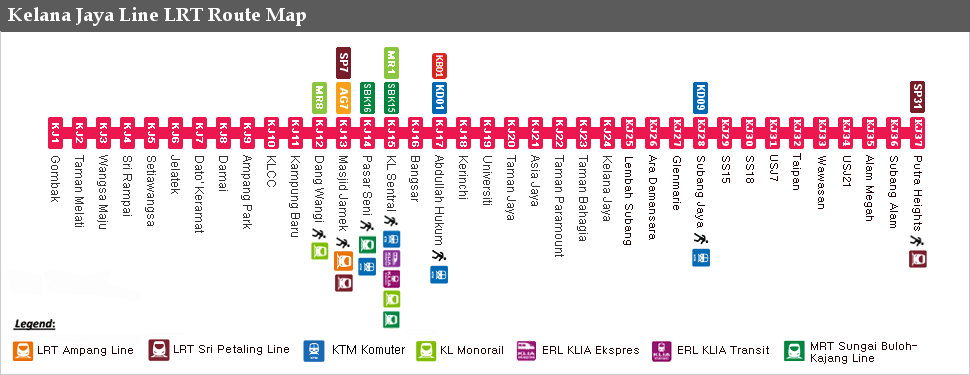
The Light Rail Transit (LRT) system is a rail system used to transport passengers in metropolitan areas. This research focuses on the Kelana Jaya Line LRT. The LRT Kelana Jaya Line is highlighted with yellow colour in Figure 2.2. The LRT Kelana Jaya Line (Line 5, formerly known as the PUTRA Line) comprises 37 stops and covers 46.4 kilometers between Gombak and Putra Heights. As shown in Figure 2.3, the full route of the LRT Kelana Jaya Line. Malaysian authorities initially constructed the line in 1998 and extended it in 2016 owing to the city’s severely grid-locked highways. The Kelana Jaya Line transports around 329,406 passengers every day as it is one of the most established rail lines in the Klang Valley, contributing the highest ridership among all the lines (MOT, 2019). Furthermore, the LRT rail line significantly integrates the rail networks in Malaysia and is expected to mitigate the intense traffic congestion in those concerned areas.
2.5 Impact of Urban Rail Transport Noise Pollution
Rail is often regarded as one of the most ecologically benign modes of transportation, having the capacity to operate with significantly reduced emission levels. However, in recent decades, it has surpassed road traffic noise as the second most significant form of environmental noise pollution in Europe, trailing only air traffic and industrial noise. An estimated 22 million individuals in Europe are exposed to railway noise levels of at least 55 dB(A), with 17 million exposed to levels of at least 50 dB(A) (Peris, 2020). Railway noise is a significant source of annoyance for residents living near railway tracks (Shahidan et al., 2017). According to a study conducted in Chongqing, the noise at the measurement point near the light rail was over 80 dB, severely affecting the nearby residential buildings. The noise level was extremely high within 60 meters of the light rail (Zhao et al., 2020). In addition, Muralidharan et al. (2018) found that students who live near the Bhandup railway station do not get enough sleep and are stressed out.
2.6 Noise Level Before LRT Construction
Previously, a study done by Yaakup et al. (2000) observed that during the years 1998–1999, 31 percent of the region in Kuala Lumpur and Klang had a great increment level of generated noise as compared to 13 percent of the trend for the stated area not to encounter the loudness. Nevertheless, over 50 percent of the entire region is still maintained below the noise level, where the rural areas contribute to less noise production. Two factors resulting in expanding noise levels are high traffic volume and little effort in tree plantations. In their research, Elfaig et al. (2014) have stated that residential areas at Jalan Tong Shin, Bukit Bintang have been examined for noise quality assessment in the urban city. Noise levels recorded by Sound Level Meter (SLM) Type One in 2013 have measured the loudness reading within the range of 52.1 dBA to 72.7 dBA. Noise pollution in those areas is caused by traffic volume, consisting of transportation systems and motor vehicles used, which is associated with poor urban planning.
Halim et al. (2017) reported that residential locations at Desa Tun Razak, Kinrara Court, and Taman Sentul Utama have sensed the noise reading at 75.7 dB, 74.3 dB and 72.1 dB accordingly. The condition happened due to severe noise pollution in urbanised and industrialised locations, which affected the community as it exceeded the permissible noise limit set by the Department of Environment. Furthermore, in 2005, three residential areas in Bandar Sunway, Kelana Jaya, and Taman Megah in Petaling Jaya were selected by a researcher to measure sound in the daytime, which resulted in a maximum reading of 67 dB, 70 dB, and 72 dB (Yusoff & Ishak, 2005). The reason for having a high noise caused by traffic volume along highways in the sense of vehicle types used has been worsened by insufficient sound barriers due to specification and method usage issues to reduce the enhanced noise.
2.7 Noise Mapping
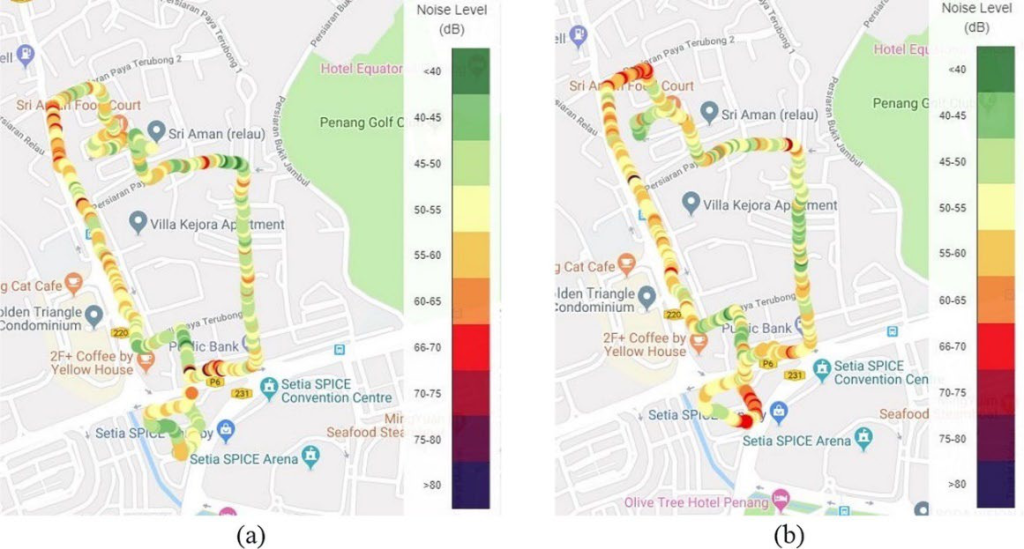
Noise mapping is graphical information to visualise the sound level with different colours to provide helpful information on environmental impact (Alam et al., 2017). The dark colour indicates a higher sound level, while the brighter colour represents a smaller number of decibels. The shades indicate the varying sound levels for a certain period addressed in urban territories (Vasilyev, 2017). Noise mapping is a valuable tool for delivering meaningful global and local action strategies (Klæboe et al., 2006), and critical points can be detected (Najah et al., 2019). As claimed by (Z. Qin & Y. Zhu., 2016), mapping the noise is one method to alleviate noise pollution where it has already become a severe threat to people, especially those living in big cities. Figure 2.4 shows the noise map of the Relau residential neighbourhood, Penang, Malaysia (Lee et al., 2020) as an example of a noise map.
As agreed by a study (Tsai et al., 2009), mapping has emerged as a powerful platform to demonstrate noise distribution. Tsai used this effective method to identify whether selected areas have disobeyed the current regulatory standard or vice versa, which needs to be reevaluated and necessary for further noise improvement. Thus, this method is done to avoid any severe effects, or else the standard itself needs to be reexamined in the sense of adequate input level. Alarming noise levels were discovered along urban rail transport tracks on noise maps in a prior study by Manoj Kumar et al. (2019), prompting suggestions for immediate noise reduction measures such as noise barriers.
2.8 Summary
This chapter defines general noise, its units, and the effects of long-term exposure to loud noise. The chapter discusses noise, including both ambient and occupational noise. It is described in greater detail to focus on environmental noise. This chapter also addressed the noise guidelines established by the authorities, covered standard noise measurement parameters, and then looked at the effects of noise pollution. Most of the impact is hazardous to one’s health and causes disruptions. Urban rail transport in the Klang Valley, where public train systems are expanding, is also discussed. The study’s train route was also discussed in this chapter. The following section of this chapter discusses the effect of urban rail noise pollution on railway noise. The railway noise is a significant source of annoyance and health risks. Before construction, there was enough noise to be concerned about how the LRT’s operation would affect the surrounding area. The impact of urban rail transportation noise on this study will be assessed using noise mapping.
Chapter 3 – Methodology
3.1 Overview
This chapter describes the approach chosen to conduct this study regarding research flow, site location, and research instrument. Following a review of various past research projects, the technique and study approach for conducting the project was developed and outlined. This chapter also goes over data collection and data analysis.
3.2 Flow Chart
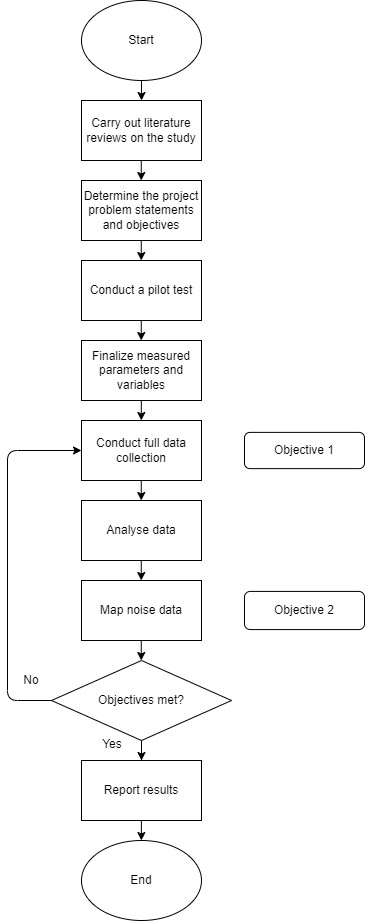
The research flow chart is depicted in Figure 3.1. The flow chart provides a concise explanation from the start of the study to a decisive conclusion. The problem statement identifies the organised specifics on how to conduct the study so that the research does not diverge from the initial purpose.
3.3 Research Approach
3.3.1 Research Flow
According to Figure 3.1, the research flow begins with conducting a literature review on studies linked to this subject. A literature review is essential since it aids in identifying and concentrating on issues that have not yet been researched previously and selecting the most appropriate technique and method for doing the study. Following that, before delving deeper into the project, it is necessary to address the project problem statements and objectives before beginning the project. It guarantees that the project remains on track and does not deviate from its original course. As a result, a pilot test was designed to simulate the entire and comprehensive data collection. This strategy aids in the analysis and improvement of the flaws that the researcher encountered throughout the whole data collection process. Based on the encountered issues, finalised measured parameters and variables were established to make data collecting easier. After that, a thorough data collection process was conducted. The measured and recorded noise data were subjected to further examination. The researcher utilised the noise data for noise mapping. Consider the following scenario: the objectives are not addressed after the analysis. In that situation, the data-gathering process will be repeated with modifications to the parameters and variables to reach the desired result. After then, if the objectives are met, the outcomes are reported.
3.3.2 Site Location
This research is focused on the LRT Kelana Jaya Line. The LRT is well-known and serves as the primary urban rail transportation line in the greater Klang Valley area. It is a popular means of transportation for commuters in Kuala Lumpur. The service is an alternative to driving, which can be congested at times (MOT, 2019). Figures 3.2, 3.3, and 3.4 depict the locations of the train stations involved in the data collection for this research.
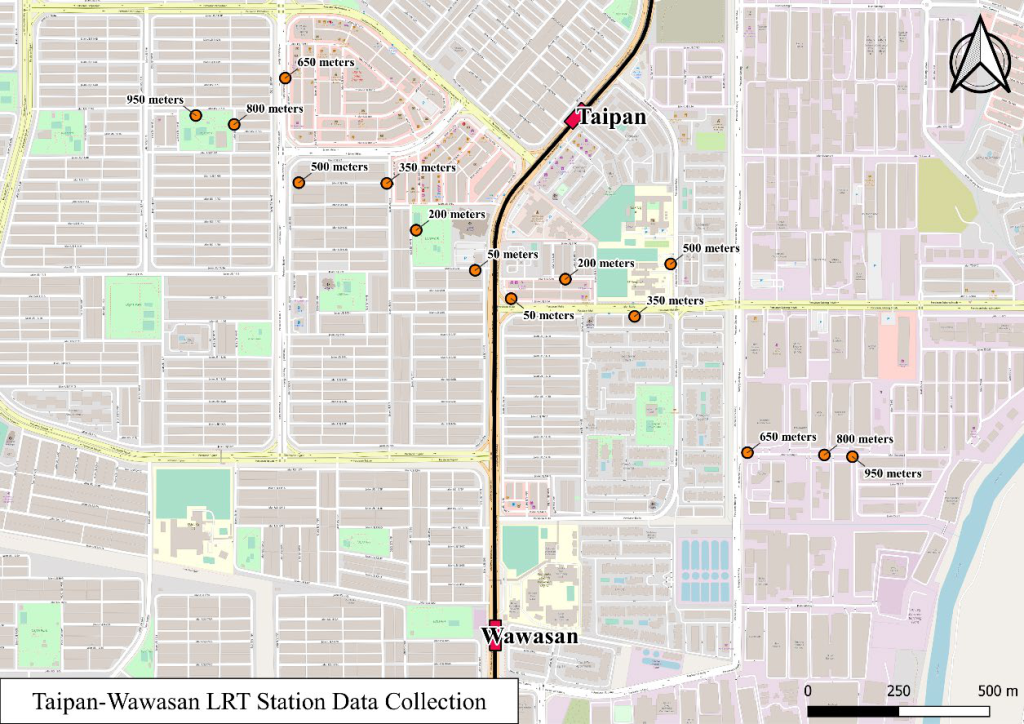
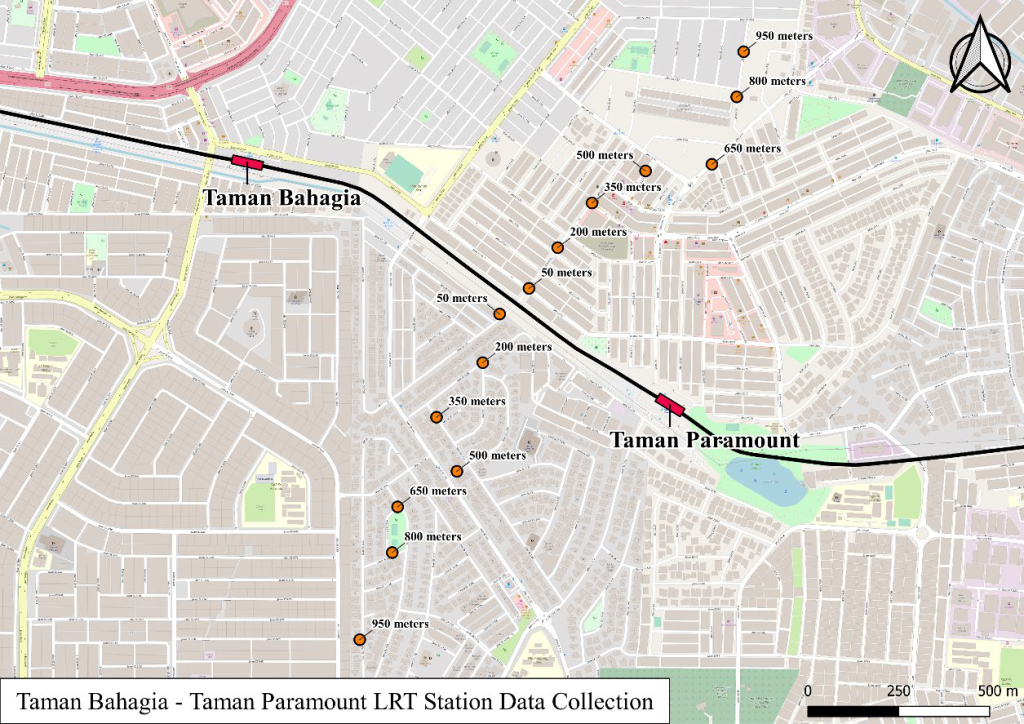
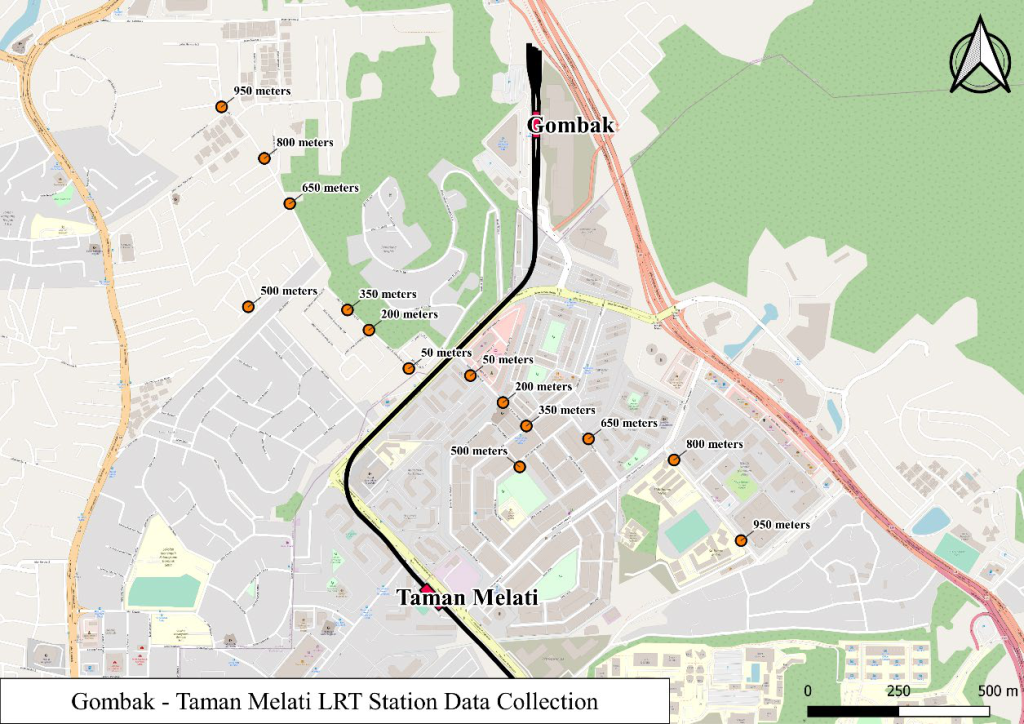
The first station is the Taipan–Wawasan station pair, the second, the Taman Bahagia–Taman Paramount stations pair, and lastly, the Gombak–Taman Melati stations pair. This research chose these stations because they are close to the residential areas. Residents must know the maximum amount of noise they are exposed to avoid further harm to their health (Azeez et al., 2005). Noise monitoring is avoided within a 500-meter radius of an LRT station because no research has been conducted in Malaysia on the effect of noise levels on inhabitants living along the rail line. The research on noise levels along the rail line is critical. Noise and vibration caused by increasing train movements, prolonged rail operating hours, and development along transportation corridors have a negative impact on rail line inhabitants (EPA NSW, 2013). The data collection points for each station pair have also been identified with their respective coordinates.
3.3.3 Noise measuring parameters
The noise levels of the ambience and when the train passes around the LRT train stations were collected and analysed in LAeq noise levels. Noise levels rise as a train arrives and fall as it passes, resulting in short-term changes in noise levels (Selamat & Rahim, 2018). The noise levels LAeq were measured following the Occupational Safety and Health (Noise Exposure) Regulations 2019 (DOSH, 2019). The radius range of noise data from the LRT train stations pair were measured at 50 meters, 200 meters, 350 meters, 500 meters, 650 meters, 800 meters, and 950 meters. The noise levels were measured for one minute, then this study calculated the average noise findings after collecting data at the exact location three (3) times to achieve a better and more precise value. The noise data was collected during the day, between 7:00 a.m. and 7:00 p.m., considering that the most active hours have the most significant impact on the noise level. On the other hand, nighttime would not ultimately provide considerable value in noise reading. People usually go back to their homes after working long hours and going to events outside their homes (Abdullah, 2020).
3.4 Data Collection
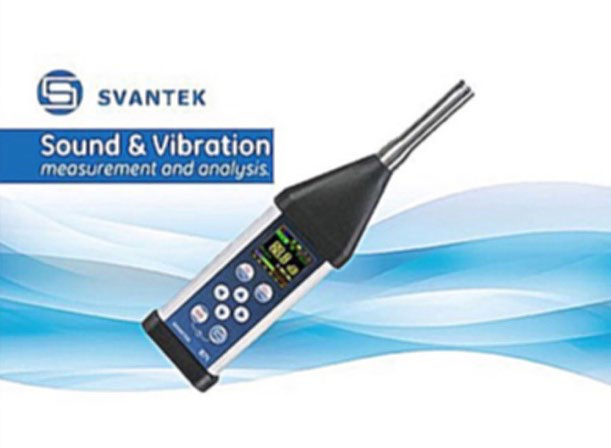
For this study, a SLM from SVANTEK Model 971 was used to measure the LAeq along the specified stretch of the LRT Kelana Jaya Line, as shown in Figure 3.5. This research equipment was chosen as an instrument owned by the Department of Mechanical and Manufacturing Engineering, Faculty of Engineering, Universiti Putra Malaysia (UPM), to compute noise measurement accurately. An acoustic measurement can be made using SLM to analyse sound levels based on the sound pressure collected from the noise source (NTI, 2018). The specs of the Svantek Model 971 SLM used to measure and record train noise are shown in Table 3.1.
| Description | Value |
| Weight | 225 g |
| Size | 232 x 56 x 20 mm |
| Standards | Class 1 : IEC 61672-1:2013, Class 1 : IEC 61260-1:2014 |
| Microphone Type | SV 7052E ACO |
| Preamplifier Type | SV 18 detachable |
| Total Measurement Range | 25 dBA Leq – 140 dBA Peak |
| Dynamic Range | 110 dB |
| Frequency Range | 10 Hz – 20 kHz |
| Weighting Filters | A, B, C, Z, LF |
| Time Constants | Slow, Fast, Impulse |
| RMS Detector | Digital True RMS detector with Peak detection, resolution 0.1 dB |
Aside from that, the benefits of employing SLM are that it is portable, allowing for better handling while measuring noise. (Das et al., 2019). Furthermore, (Pathak et al., 2008) stated in their research that the SLM could measure sound like that of the human ear, hence contributing to the consistent noise level assessment. A calibrated sound level meter is essential for confirming any computation to get an accurate measurement and conform to the standard in question (Dwisetyo et al., 2021). So, this SLM had been calibrated before collecting data to ensure that the measurements were correct.
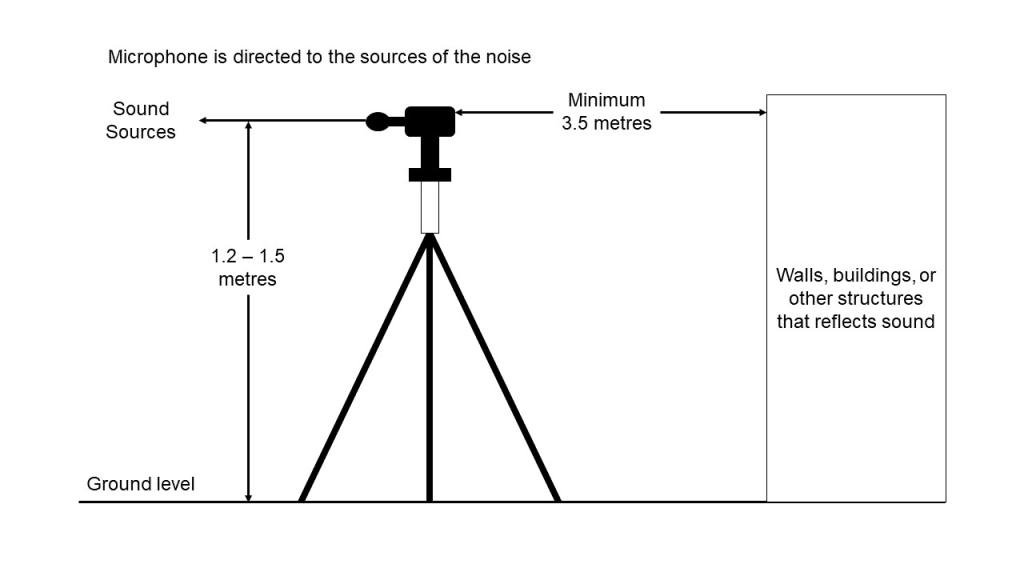
According to the DOE (2019), the microphone placements for detecting train noise levels must be at least 1.2 meters above the ground and at least 3.5 meters away from any reflecting surfaces other than the ground. The microphone must be positioned to respond to incident sounds from rail tracks or viaducts. As shown in Figure 3.6, the SLM was set on a tripod per the guidelines stated by the DOE to produce a uniform reading in the vertical range. The windscreen that came with the SLM was used to keep noise levels from being affected by the wind. Extraneous noise events at the measurement location that is non-train related were identified and recorded as events that may have influenced the measured noise levels.
3.5 Data Analysis and Mapping
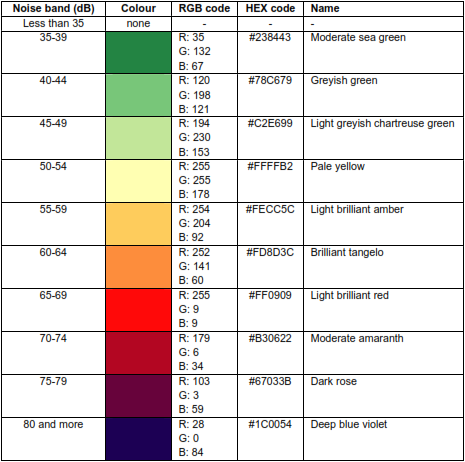
After collecting the raw data from the noise measurement, data analysis was performed to convert the information into noise contour mapping activity. A noise map depicts the distribution of sound levels and the propagation of sound waves in a specific area over time. Noise maps allow for the study of the status of the noise pollution problem and are also helpful in determining the success of noise abatement methods. Different colours from the map’s colour contour are employed (dB) to depict the LRT’s noise bands (Sommerhoff et al., 2004). The colour indicator becomes darker as the noise value increases; hence, a lower noise value shows a brighter colour code, corresponding to a lower sound reading in decibel units (Selamat & Rahim, 2018). The colour code in Table 3.2 serves as a guide for the coloured noise maps. The colour will darken as the noise level sign rises above 55 decibels (dB). Meanwhile, the colour indicator becomes brighter and greener for 55 dB or less noise levels, showing that the surrounding noise level is safe.
This project utitlised the Quantum Geographic Information System (QGIS) to provide users with an interactive visualisation. Aside from that, this application offers good imagination for researchers to sketch parameters on the map coordinates based on the actual site engaged in their research field. The QGIS programme proved to be a helpful tool for making maps from geographical and non-spatial data. Because it is user-friendly and open-source, QGIS is an effective tool for creating noise maps (Vilas et al., 2018).
Chapter 4 – Results and Discussion
4.1 Overview
This chapter describes the results of the noise generated by LRT trains along the selected route of the LRT Kelana Jaya Line. The noise was measured at various distances from the tracks between the Taipan – Wawasan, Taman Bahagia – Taman Paramount, and Gombak – Taman Melati LRT Stations. The results of the noise measurements and noise mapping were thoroughly discussed throughout this chapter. Appendix A contains the full tabulated noise measurements.
4.2 Noise Measurement Results
Noise measurements were taken using Svantek 971 sound level meter equipment, and average values were calculated for each ambience and train passing noise. Each noise measuring point was subjected to six noise measurements. For instance, six noise measurements were taken at the Quadrant 1 650-meter point; the same was true for other points. Each quadrant’s noise measurements were tabulated, including ambience noise, train passing noise, and noise level difference. The difference in noise level is calculated by subtracting ambient and train passing noise at their respective distances to observe the increase in noise level when the train passes compared to ambient noise.
Furthermore, the noise measurements’ standard deviations were calculated to observe the difference between the mean value from each noise produced to ensure that the data is clustered closely around the mean, implying more reliable data were obtained. The average standard deviations of the noise measurements are 1.9 dBA, indicating that the noise measurement is very close to the average reading. The standard deviation values for each noise measuring point are shown in Appendix C.1. Further research should take more noise measurements to obtain more accurate average readings and lower standard deviation values. Using a more sensitive sound level meter contributes to the accuracy and consistency of noise measurements. The ambient noise level fluctuates, possibly due to other obtrusive noise sources. Motorcycles, heavy trucks or lorries, aeroplanes, machine sounds from construction sites, honking and exhaust sound from vehicles, and machine sounds from construction sites have been identified as the most annoying noise sources.
The noise levels recorded at each track segment vary due to the design and surrounding area of the railway tracks and other factors that affect the noise level generated near the railway tracks. The noise levels also reveal that when the distance between the noise source and the receiver grows, the noise measured by the receiver decreases, most likely owing to sound pressure loss. Sound pressure results from sound sources radiating sound energy into a particular acoustic environment, which is then measured at a specific location. The surface area surrounding a point sound source rises according to the square of the distance from the source. This implies that the same amount of sound energy from the source is dispersed across a greater region, and the intensity of the energy drops proportionately to the square of the distance from the source. This concept is often referred to as the inverse square law. In accordance with the inverse square law, the sound pressure level decreases by around 6 dB for every doubling of distance from a point source (Collman, 2015).
This suggests that extending the distance between the noise source and the receiver or constructing a barrier between the noise source and the receiver will greatly lower the noise level received. Physical barriers, such as buildings, trees, and bushes, cause noise to be reflected and absorbed, reducing its level and ability to propagate. In nearly 20% of the recorded noise measurements, the ambient noise exceeded the DOE’s 60 dBA threshold for urban residential areas (high-density areas). Fortunately, only two train noise measurements exceeded the DOE’s allowable levels of more than 65 dBA for urban residential areas. These findings are shown in Appendix B.1.
4.2.1 Noise Level at Taipan – Wawasan LRT Station Pair
LRT Station Pair
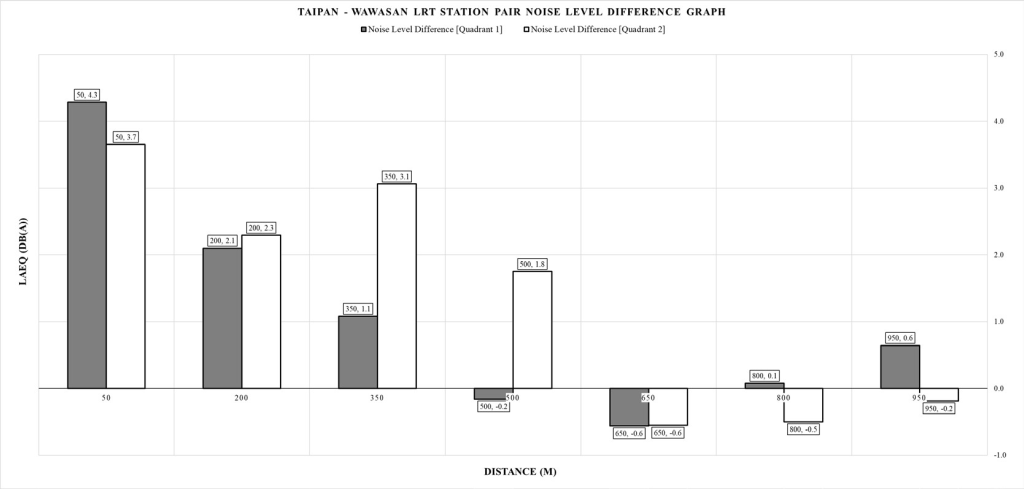
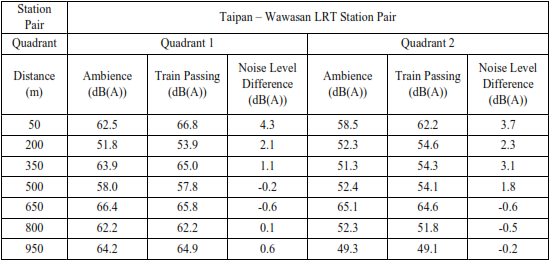
Table 4.1 separates the noise measurements from the Taipan – Wawasan LRT station into two-quadrant columns. These two columns allow us to compare noise levels between the two quadrants, as noise measurements for each station pair were taken from opposite sides of the LRT line. Using A-weighted equivalent continuous noise level LAeq (dBA) measurements, the noise measurement is tabulated as an ambience, train passing, and noise level difference based on the distance from the train tracks.
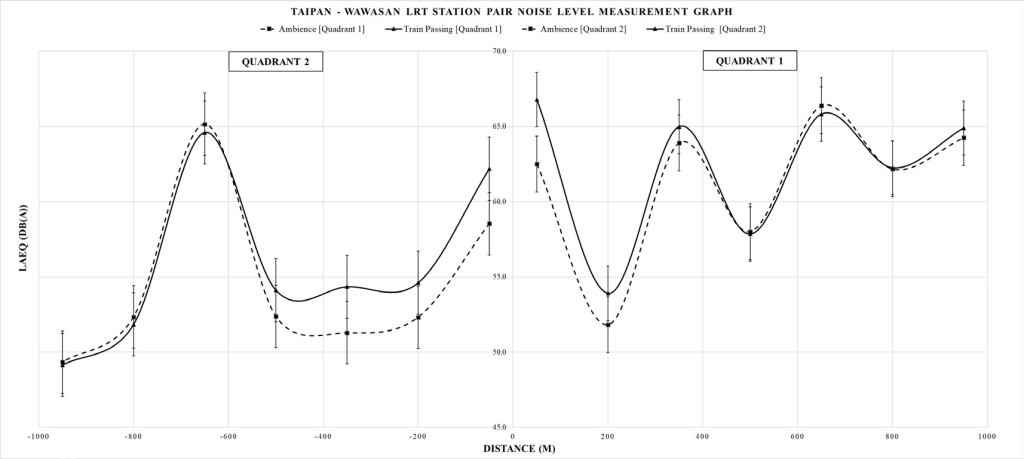
The noise level measurements of ambience and train passing noise for both quadrants were plotted on the same graph, with distance (m) representing the x-axis and the equivalent continuous noise level LAeq (dBA) representing the y-axis as shown in Figure 4.1. The left side of the graph displays Quadrant 2 noise measurements, which someone should read from the centre to the left, and the right side of the graph displays Quadrant 1 noise measurements, which someone should read from the centre to the right. All noise level measurement graphs adhere to the above- described format.
Furthermore, the noise level difference was plotted as a clustered column in Figure 4.2, with distance (m) representing the x-axis and the equivalent continuous noise level LAeq (dBA) representing the y-axis. The first grey coloured bar represents Quadrant 1 and the second white coloured bar Quadrant 2, respectively. All noise level difference graphs adhere to the described format.
Every 350 meters, the ambient noise level in Quadrant 1 approaches peaks and troughs. This noise pattern is likely a result of the area’s heavy road traffic and numerous industries. Additionally, the noise when the train passes exhibit the same behaviour as the ambient noise in the quadrant. In addition, at distances of less than 500 meters, the train’s noise is consistently louder than the ambient noise. Within a range of 650 to 950 meters, the train’s passing noise is at most 0.6 decibels (dBA) less than the ambient noise. This behaviour may be explained by the sound pressure loss of the train passing noise and the fluctuation of ambient noise from road traffic and industrial noises, which diminishes the train passing noise’s significance.
Meanwhile, in Quadrant 2, the ambience and train passing noise follow the same pattern, with the train passing noise being more significant than the ambience noise for distances less than 650 meters. The noise produced by the train is lower than the ambient noise by a maximum of 0.6 dBA between 500 and 950 meters. Because of the noise measuring point’s proximity to a busy road, ambient and train passing noise reach peak levels at 650 meters. Then, both noise levels fall below 55 decibels. This noise reduction is most likely due to the noise measuring point being in a quiet and guarded residential area, which causes the noise level to drop significantly.
The noise level difference is used to calculate and observe the significance of train passing noise versus ambient noise. The noise level difference is significant for distances of less than 500 meters in Quadrant 1 and 650 meters in Quadrant 2. The reason is that the noise level difference at 500 meters in Quadrant 1 was -0.2 dBA, while it was -0.6 dBA at 650 meters in Quadrant 2. These negative noise level difference values demonstrate that the train passing noise is insignificant compared to the ambient noise. According to Table 4.1, the noise level difference can exceed one dBA, with the highest peak value recorded being 4.3 dBA. A 1 dBA increase, for example, is negligible because it equates to a 26 per cent difference in sound energy (Moeller, 2012). However, according to IOSH (2018), a three dBA increase has a greater impact on hearing health. 63 dBA, for example, is twice as loud as 60 dBA. When considering noise exposure, the significance of this becomes clear. The noise level rises by 3 dB for every 3 dB increase, and the exposure time must be cut in half to keep people safe. Train passing noise is significant and impacts environmental noise up to 500 meters in Quadrant 1 and 650 meters in Quadrant 2. The train passing noise is insignificant over longer distances.
4.2.2 Noise Level at Taman Bahagia – Taman Paramount Station Pair
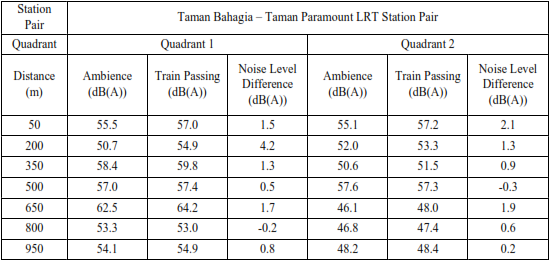
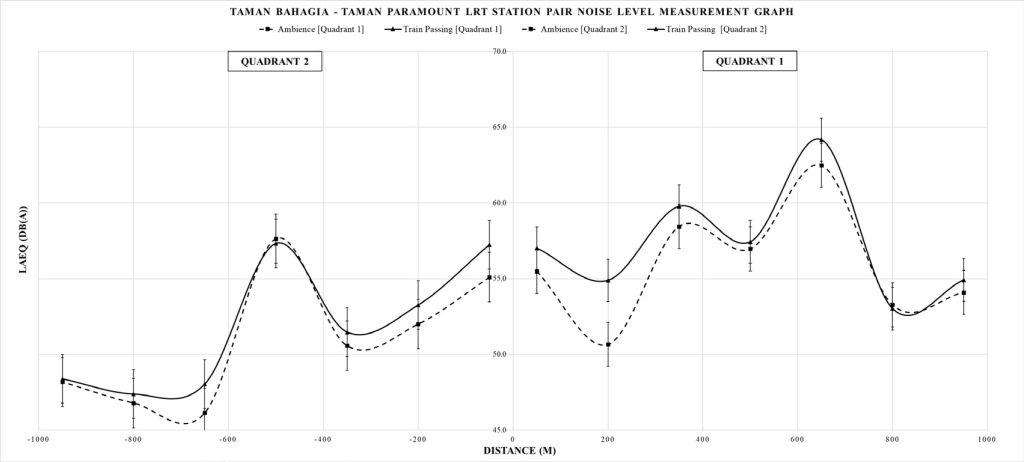
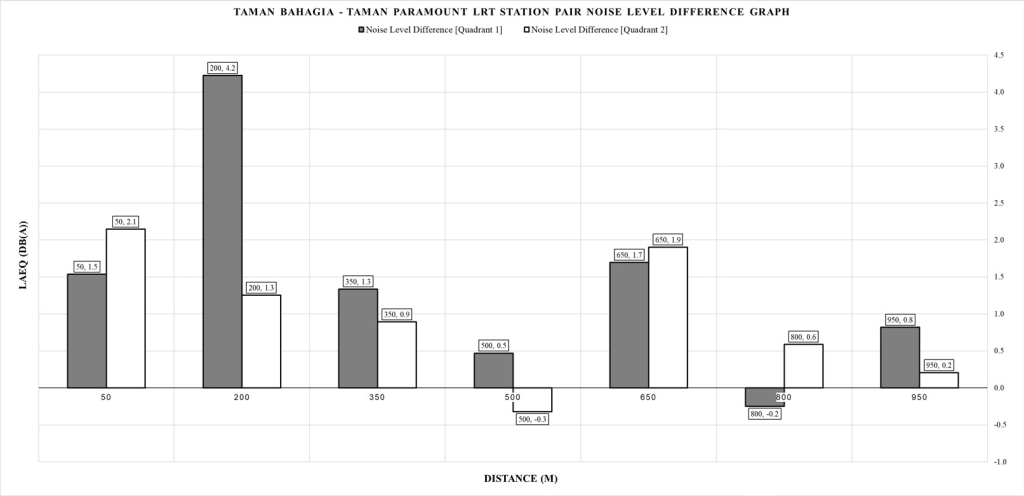
Table 4.2 and Figure 4.3 demonstrate that the ambient noise level in Quadrant 1 approaches peaks and troughs every 350 meters. This noise pattern is likely attributable to the region’s heavy road traffic and commercial activities. In addition, the noise produced by the train exhibits the same characteristics as the ambient noise in the quadrant. In addition, the train’s noise is consistently louder than the ambient noise at distances of less than 800 meters. Within 800 meters or further, the train’s passing noise is no less than 0.2 decibels (dBA) below the ambient noise. This behaviour may be explained by the loss of sound pressure of the train passing noise and the fluctuation of ambient noise from road traffic and commercial activities, which diminishes the significance of the train passing noise.
In Quadrant 2, ambience and train passing noise follow the same pattern, with the train passing noise being more noticeable than ambience noise at distances less than 500 meters. At 500 meters, the train’s noise is lower than the ambient noise by a maximum of 0.3 dBA. Due to the proximity of the noise measurement point to a busy road, ambient and train passing noise peaks at 500 meters. Then, both decibel levels drop below 50. This noise reduction is most likely attributable to the fact that the noise measuring point is in a quiet residential area, causing the noise level to drop significantly.
Figure 4.4 demonstrates that the difference in noise level is significant at distances of less than 800 meters in Quadrant 1 and 500 meters in Quadrant 2. The reason is that the noise level difference at 800 meters in Quadrant 1 was -0.2 dBA, while at 500 meters in Quadrant 2, it was -0.3 dBA. These negative differences in noise level indicate that the train passing noise is negligible compared to the ambient noise. According to Table 4.2, the noise level difference can exceed one decibel, with a peak value of 4.2 decibels recorded. Significant train passing noise impacts ambient noise up to 800 meters in Quadrant 1 and 500 meters in Quadrant 2. Train passing noise is negligible at greater distances.
4.2.3 Noise Level at Gombak – Taman Melati LRT Station Pair
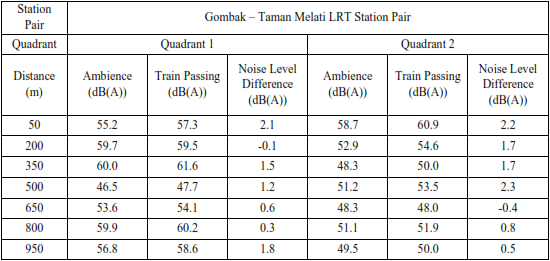
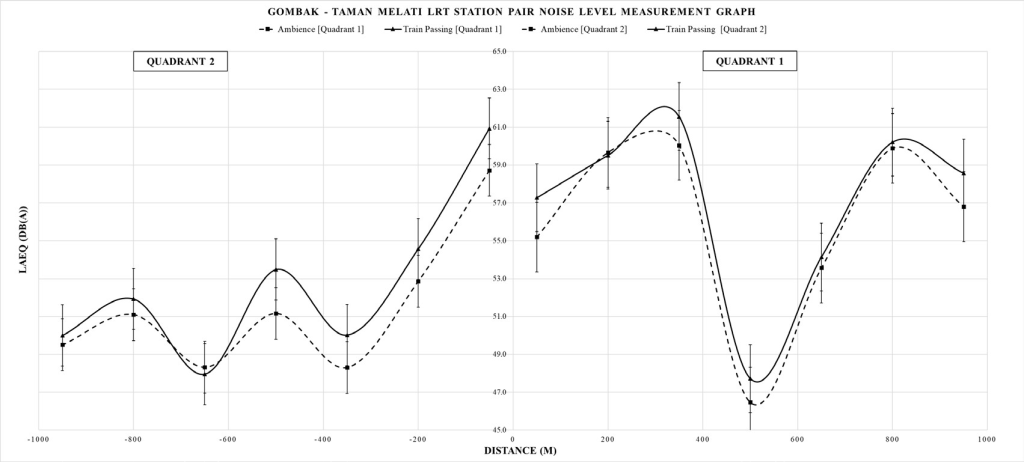
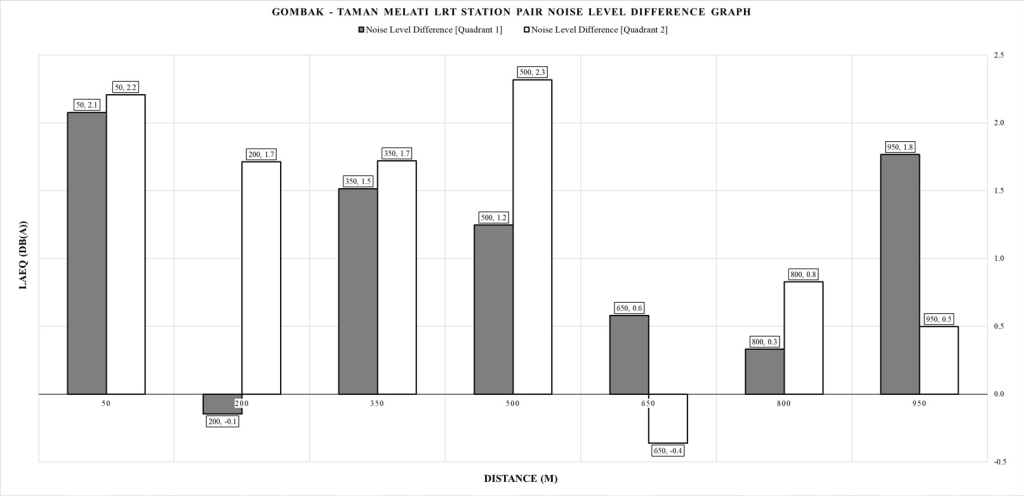
Table 4.3 and Figure 4.5 show that ambient and train passing noise levels in Quadrant 1 have sharp peaks and troughs, with a peak at 350 meters, a sharp drop at 500 meters, and a sharp increase at 800 meters. This noise pattern is most likely caused by heavy traffic and a quiet residential area with a park. Furthermore, at distances of less than 200 meters, the train’s noise is slightly louder than the ambient noise. The train’s passing noise is less than 0.1 decibels (dBA) below the ambient noise within 200 meters. This behaviour can be explained by the loss of sound pressure caused by train passing noise and the fluctuation of ambient noise caused by road traffic and commercial activities, which reduces the significance of the train passing noise.
The ambient and train passing noise levels in Quadrant 1 gradually decrease to less than 51 dBA at 350 meters, with peaks and troughs every 150 meters. This noise pattern is likely due to the region’s terrain, as the noise measuring point is hidden behind a hill, although the equipment faces the train tracks. The presence of the hill most likely reduces the propagation of train noise. Furthermore, at distances of less than 650 meters, the train’s noise is consistently louder than the ambient noise. The train’s passing noise is less than 0.4 decibels (dBA) below the ambient noise within 650 meters. This behaviour may be explained by the loss of sound pressure caused by the train passing noise, as well as the presence of many trees and a hilly terrain, which reduces the significance of the train passing noise.
Figure 4.6 shows a significant difference in noise level at distances of less than 200 meters in Quadrant 1 and 650 meters in Quadrant 2. The reason is that the noise level difference at 200 meters in Quadrant 1 was -0.1 dBA, while it was -0.4 dBA at 650 meters in Quadrant 2. These negative noise level differences indicate that the train passing noise is insignificant compared to the ambient noise. The noise level difference can exceed one decibel, according to Table 4.2, with a peak value of 2.3 decibels recorded. Train passing noise impacts ambient noise up to 200 meters in Quadrant 1 and 650 meters in Quadrant 2. At greater distances, train passing noise is negligible.
4.3 Noise Mapping
The inverse distance weighted (IDW) interpolation method was used for noise mapping to generate sound contours. Interpolation is a technique to predict cell values at locations with insufficient data. According to Verma, Jana, and Ramamritham (2019), the IDW interpolation technique was chosen over other techniques because it is easier to set the parameters and interpret the results while maintaining performance comparable to other interpolation techniques. In general, spatial interpolation techniques use known values to estimate the values of locations with unknown values. IDW utilises local interpolation, which gives neighbouring points with known values greater weight than all access points. The inverse distance weighted can regulate the significance of known points, their distance from the output point, and their interpolated values. IDW can provide interpolated surface grid values and structures with precision. Numerous noise maps that investigate the impact of road and rail traffic noise employ this interpolation method.
The noise map is colour-coded according to the noise level. The noise band of the colour code determines the colours used for LRT station noise maps. The colour code directs the chromatic noise maps. The colour will become darker as the noise level indicator exceeds 59.0 dBA. At or below 59.0 decibels, the colour indicator becomes brighter and green, indicating that the ambient noise level is safe. The orange colour contour in the surrounding area of the map indicates that noise can spread further away from the station, causing discomfort for those in the neighbourhood. The surrounding structure can also block low noise levels but cannot reduce the train’s high-pitched noise. Only when there are no obstacles can sound travel. This research had no building or height restrictions, resulting in level terrain due to software limitations.
4.3.1 Noise Map of Taipan – Wawasan LRT Station Pair
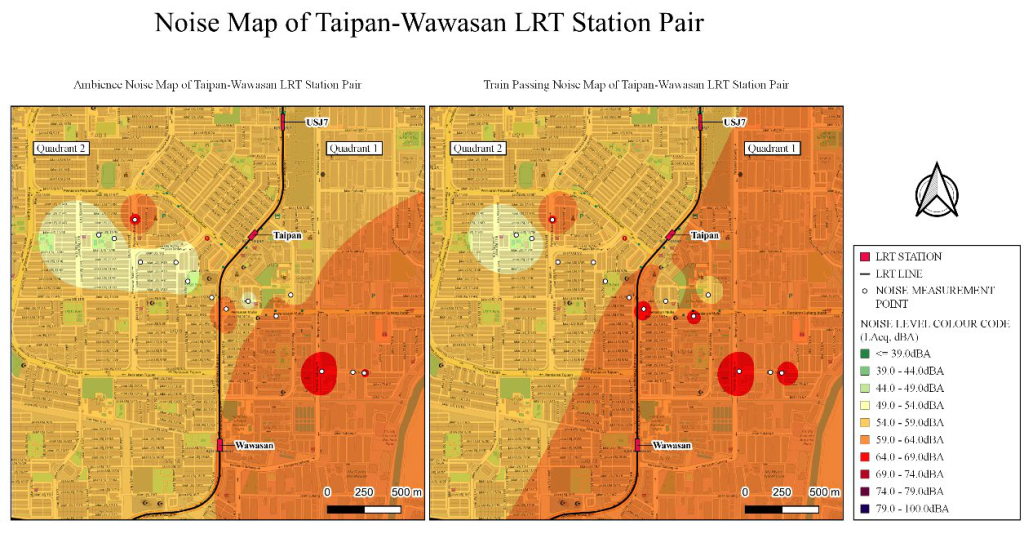
Figure 4.7 illustrates the noise map for ambient noise and train passing noise at the Taipan and Wawasan LRT stations. The noise contours were mapped on the noise map using the IDW interpolation method. This station pair region has predominantly flat topography. On the right side of the LRT line, Quadrant 1 consists primarily of residential and industrial districts, including apartments, flats, schools, and small to medium-sized industries. Quadrant 2 consists primarily of residential and commercial districts, including two-story shop lots, two-story terrace residences, public parks, and a mosque.
The only noise measurement point exceeding the acceptable ambient noise level of 60 dBA in Quadrant 2 is 650 meters. The reason is due to the proximity of the noise measurement spot to the bustling Persiaran Bakti road. Noise from vehicles may cause the high noise level recorded. All noise measurement stations in quadrant 1 exceed the allowable ambient noise level of 60 decibels near the busy Persiaran Subang road and the USJ Industrial Area. Besides that, the build-up density, non- existence of noise barrier, and green areas cause the noise level to be high. The train passing noise map demonstrates that train passing does affect the surrounding noise level, as the area within 200 meters of the train lines gets redder than the ambient noise map. The red colour contour surrounding the map indicates that the noise can spread further away from the station, causing inconvenience for the residents.
4.3.2 Noise Map of Taman Bahagia – Taman Paramount LRT Station Pair
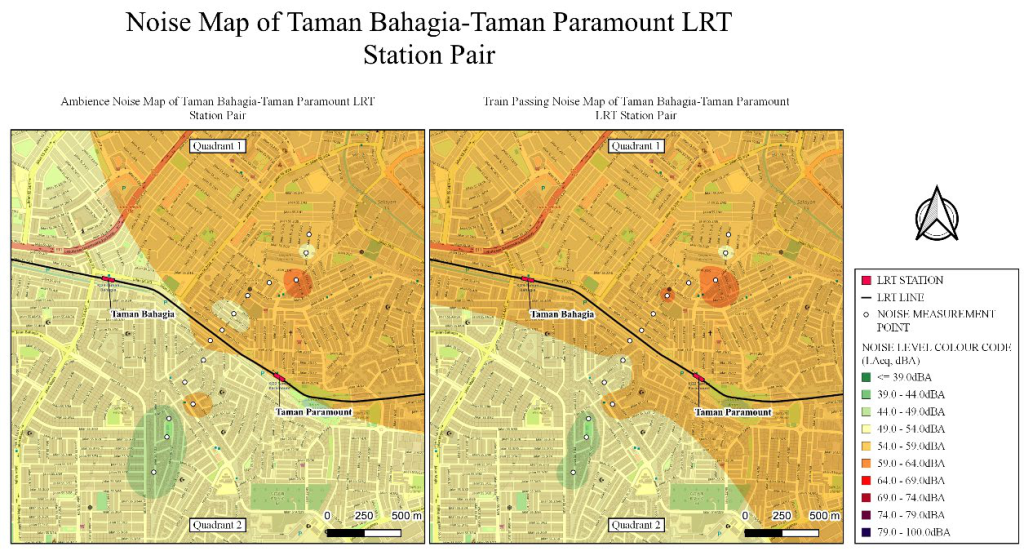
Figure 4.8 depicts the noise map for ambient and train passing noise at the LRT station pair Taman Bahagia – Taman Paramount. The noise contours were mapped on the noise map using the IDW interpolation method. This region’s landscape is predominantly hilly. Quadrant 1 at the top of the LRT line consists of residential and commercial spaces, such as storefronts and two-story homes. Quadrant 2 comprises residential neighbourhoods, including bungalows and two-story terrace homes, on the opposite side of the map.
In addition, only one measurement site in quadrant 1 exceeds the permissible ambient noise level of 60 dBA at 650 meters due to its proximity to the SEA Park commercial district. In Quadrant 2, no noise measurement locations are louder than the acceptable ambient level. The train passing noise map indicates that passing trains affect the surrounding noise level, as the area within 500 meters of train tracks becomes more orange than the ambient noise map. The orange contour encircling the map indicates that the noise can travel further away from the station, causing discomfort among the local population.
4.3.3 Noise Map of Gombak – Taman Melati LRT Station Pair
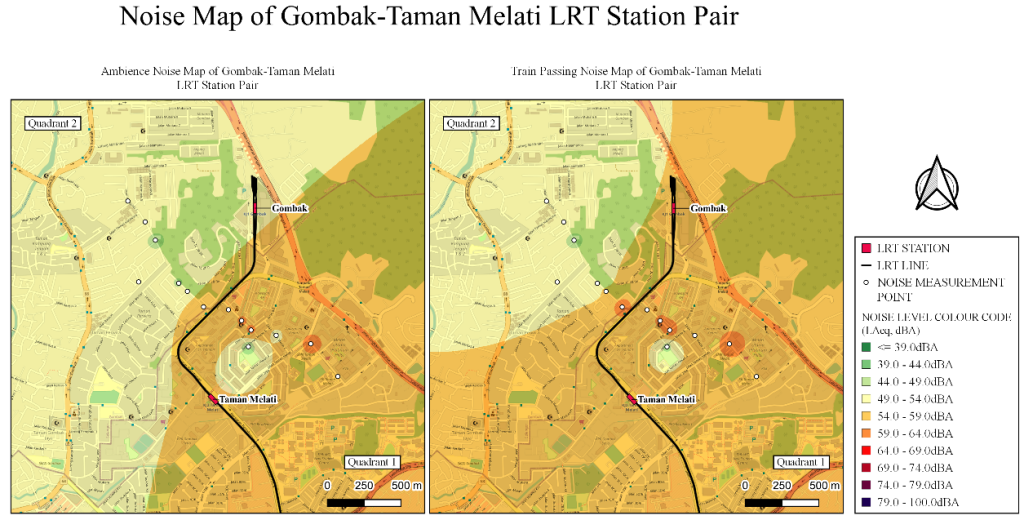
Figure 4.9: The noise map of Gombak – Taman Melati LRT station pair The noise map for ambient and train passing noise for the LRT station pair Gombak – Taman Melati is shown in Figure 4.9. The IDW interpolation method was used to map the noise contours onto the noise map. The topography of Quadrant 1 is flat, located on the lower right of the LRT line, whereas Quadrant 2 is hilly and mountainous, located on the upper left of the LRT line. Quadrant 1 is primarily made up of residential areas, including apartments, a mosque, and two-story terrace houses. Meanwhile, quadrant 2 is mostly made up of two-story homes and bungalows.
Only one noise measurement site in Quadrant 1 exceeds the allowable ambient noise level of 60 dBA at 350 meters due to its proximity to the Jalan Taman Melati 8 road. No noise measurement sites in Quadrant 2 exceed the allowable ambient level. The train passing noise map shows that train passing affects the surrounding noise level because the area within 200 meters of the train lines turns more orange than the ambient noise map. The orange colour contour around the map indicates that noise can travel further away from the station, causing discomfort to residents.
4.4 Societal, Health, and Safety Impact
Compared to road traffic noise, railroad noise’s impact on society, health, and safety is a much more complicated issue. Many factors influence railroad emissions. The technical condition of the tracks and rolling stock, the type of brakes used, the volume of traffic, and the terrain of the surrounding area, for example, can all impact railroad noise emissions. The Klang Valley area has been subjected to constant train noise since the introduction of intracity train transportation in the metro area. However, there are two impediments to addressing the city’s train noise: a lack of resources and a lack of political will. Introducing an LRT train into the city will impact society, health, and safety, which are often invisible to the naked eye as most nuisances come from noise and vibrations.
Loud noise from trains can cause stress, high blood pressure, heart disease, and sleep disturbances (Muralidharan et al., 2018). In the long term, loud noise also always results in noise-induced hearing loss (NIHL). These health problems can affect people of all ages, not just children. Additionally, loud noises may lead to pedestrian accidents and injuries by making it harder to hear warning signals (World Health Organization, 2013). Abdullah (2020), who studied the impact of the Kajang Line MRT noise on property prices, found that an increase in noise level by 1 dB was accompanied by a drop in the unit price of a property by RM 5.93/sqft. These findings show that an increase in noise level caused by trains could affect the property value and attractiveness. Trains vibrate in addition to making noise, but how vibration affects passengers beyond their discomfort is unclear.
4.5 Summary
Each noise point had six measurements. Ambient noise, train passing noise, and noise level difference were tabulated. The noise measurement’s average standard deviation is 1.9 dBA, indicating it is close to the average. Nearly 20% of ambient noise measurements in urban residential areas exceeded 60 dBA (high-density areas). Only two train noise measurements exceeded the DOE’s 65 dBA urban residential limit. The Taipan-Wawasan station pair’s train noise affects the environment up to 500m in Quadrant 1 and 650m in Quadrant 2. Train passing affects the surrounding noise level, with the area within 200 meters of train lines turning redder than the ambient noise map. Significant train noise impacts ambient noise up to 800 meters in Quadrant 1 and 500 meters in Quadrant 2 for Taman Bahagia – Taman Paramount. The train passing noise map shows that passing trains impact surrounding noise levels, as the area within 500 meters of train tracks turns more orange than the ambient noise map. The Gombak- Taman Melati station pair train’s noise travels 200 meters in Quadrant 1 and 650 meters in Quadrant 2. The train passing noise map shows how train passing affects surrounding noise by turning the area within 200 meters of train lines more orange than the ambient noise map. Train noise affects health, safety, and society.
Chapter 5 – Conclusion
5.1 Conclusions
The conclusions of this project are:
- The train passing noise generated along the LRT Kelana Jaya Line affect the surrounding noise around Taipan-Wawasan station up to 500m in Quadrant 1 and 650m in Quadrant 2, up to 800 meters in Quadrant 1 and 500 meters in Quadrant 2 for Taman Bahagia-Taman Paramount, and Gombak-Taman Melati station pair train’s noise travels 200 meters in Quadrant 1 and 650 meters in Quadrant 2.
- From the noise map generated, train passing affects the surrounding noise level within 200 meters of train lines in the Taipan-Wawasan station area, turning redder than the ambient noise map. In contrast, 500 meters from train tracks in the Taman Bahagia-Taman Paramount station area turns more orange than the ambient noise map. Within 200 meters of train lines of Gombak-Taman Melati, the area turns more orange than the ambient noise map.
5.2 Recommendations
- This method of noise mapping provides noise information for only one height, which is insufficient for the noise assessment process. In the future, it will be necessary to employ three-dimensional (3D) noise models to obtain comprehensive data on noise that may pose a health risk to bystanders and residents living near train stations.
- Future research should concentrate on gathering more noise measurements to obtain more accurate average readings and lower standard deviation values. Utilising a sound level metre with a higher degree of sensitivity is one way to contribute to the accuracy and consistency of noise measurements.
- Future research should also expand the study’s scope to include an examination of the various urban rail transit choices accessible in the Greater Klang Valley Area. Consider Commuter Trains, Monorail, Mass Rapid Transit, and Light Rail Transit as examples.
5.3 Assessment on Implication to Society and Environment
Noise mapping is valuable and necessary in large cities because it allows for investigating the noise pollution effects of future development plans and their surroundings. Numerous applications exist for noise mapping, including the identification and quantification of populations exposed to environmental noise pollution, the design and evaluation of the effectiveness of environmental noise control measures, and the promotion of public policies for environmental noise management (GlobalSpec, n.d.). The DOE recommends three methods for reducing noise from trains and railroads: noise reduction at the source, transmission path changes, and receiver modifications.
The railway alignment, the addition of a buffer zone between homes and the tracks, the design of viaducts, the design of trains, the types of rails used, the quality of construction workmanship, the addition of wheels screening or trains under-car skirts, the implementation of train speed limits, and the types of wheels used could all be used to reduce noise at the source. Building noise barriers, enclosures, trackside rail screening, and absorption are all ways to alter the path of the sound. Building orientation and the installation of sound insulation on windows and doors are examples of receiver modifications.
The LRT station mapping for this project has allowed engineers and safety officers to assess noise levels and implement risk mitigation. This research also increases awareness of train safety, health, and safety issues. This research also promotes greater openness and public acceptance by fostering a broader comprehension of the evolution of noise mapping. In terms of the Sustainable Development Goals (SDG), the application for noise mapping might be utilised to meet the following Sustainable Development Goals: SDG 3 – Good Health and Well-Being; SDG 9 – Industry, Innovation, and Infrastructure; and SDG 11 – Sustainable Cities and Communities.
Leave a Reply